Electrician Hourly Pay in Walla Walla, WA: $40.71 (2026)
Quick Answer:Hourly pay for a electrician working in Walla Walla, WA runs $40.71 at the median for 2026 — annualizing to $84,668 at a standard 2,080-hour year. Figures projected from BLS OEWS 2025 (SOC 47-2111). Weighted against Walla Walla's regional price level (BEA RPP 98.5, 1% below national), each hour of work buys what $41.32 nationally would. A 24-hour part-time schedule grosses $50,800 per year.
Official BLS data · View source
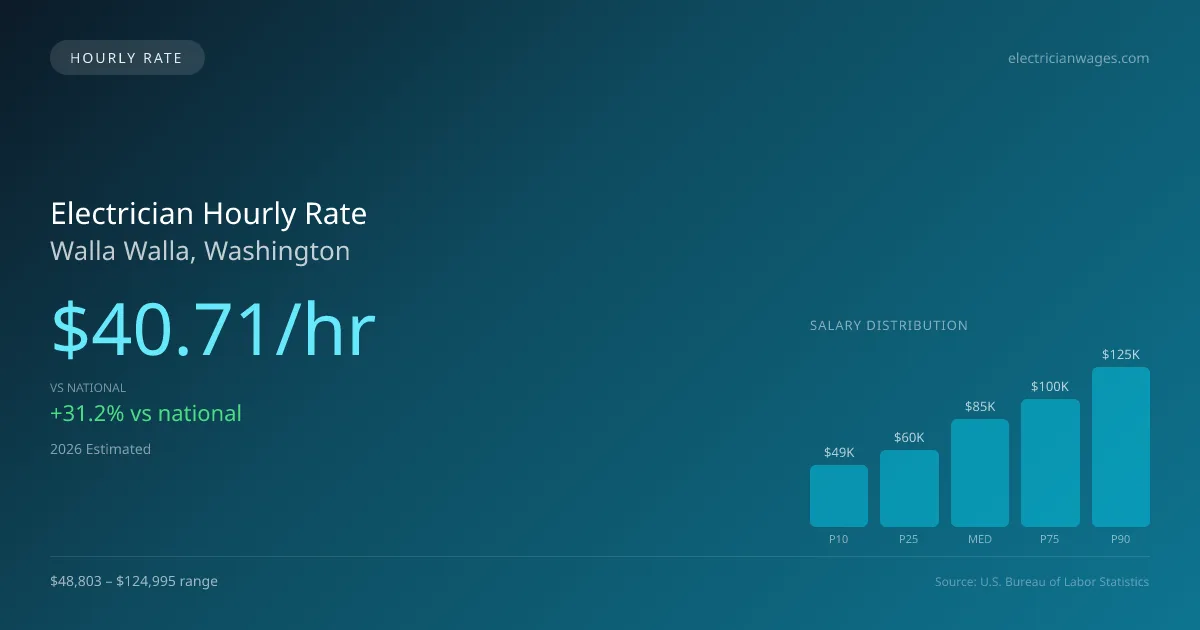
In Walla Walla, Washington, electricians command a median hourly rate of $40.71, significantly higher than the national median of $31.02. This competitive rate reflects the demand for skilled electricians in various settings, including commercial and industrial construction sites, residential service calls, and utility line maintenance. For those in part-time roles, such as working three days a week, this hourly wage translates to substantial weekly earnings, making it an attractive option for individuals balancing other commitments. The overall hourly pay range for electricians in the area stretches from $23.47 at the lowest decile to an impressive $60.10 at the top, illustrating the potential earnings for both entry-level positions and experienced professionals alike. These figures are based on 2025 BLS OEWS data, projected to 2026, ensuring accuracy in forecasting earnings for those pursuing careers in this critical trade.
Electrician Hourly Wage Breakdown
| Percentile | Hourly Rate | Per 8hr Shift |
|---|---|---|
| Entry Level (P10) | $23.47 | $187.74 |
| Lower Range (P25) | $28.98 | $231.85 |
| Median (P50) | $40.71 | $325.64 |
| Upper Range (P75) | $48.10 | $384.79 |
| Top Earners (P90) | $60.10 | $480.78 |
Estimated Annual Income by Work Schedule in Walla Walla
Based on $40.71/hr median hourly rate · 2026 est.
At $40.71/hr, a electrician working full-time (40 hr/wk) in Walla Walla, WA can expect to earn approximately $84,666 per year (2026 est.). Part-time hygienists working 24 hours per week would earn around $48,846. With a cost-of-living index of 98.52 (below the national average), these earnings stretch further in Walla Walla.
Hourly Rate Calculator
Schedule Comparison in Walla Walla
| Schedule | Weekly | Monthly | Annual |
|---|---|---|---|
| Full-Time (40 hrs) | $1,628.20 | $7,056 | $84,666 |
| Part-Time (24 hrs) | $976.92 | $4,233 | $50,800 |
| Per Diem (16 hrs) | $651.28 | $2,822 | $33,867 |
Compare ELEC Wages With Similar Roles
| Role | Median Hourly |
|---|---|
| Electrician (Walla Walla) | $40.71 |
| Plumber (National Avg) | $32.85 |
| HVAC Technician (National Avg) | $28.47 |
| Industrial Machinery Mechanic (National Avg) | $29.53 |
| Solar PV Installer (National Avg) | $24.85 |
Electricians in Walla Walla, WA earn a median of $84,668 per year (2026 est.), which is 31.21% higher than the national median of $64,530 and 14.20% below the Washington state average of $98,680.
Electrician Hourly Pay vs. Cost of Living
Working 24h/week at $40.71/hr = $50,800/year (purchasing power: $51,564).
Working 40h/week (full-time) = $84,666/year (purchasing power: $85,939).
CoL index: 98.519 (100 = national average). Your dollars stretch further here.
2019 BLS Actual
$28.78/hr
2025 BLS Actual
$39.86/hr
2026 Current Est.
$40.71/hr
2019–2027 Growth
+44.4%
Hourly Rate Trajectory for Electricians in Walla Walla (2019–2027)
2019–2025: actual BLS OEWS data for this metro area. 2026+: CAGR 2.12% projection.
| Year | Hourly Rate | Status |
|---|---|---|
| 2019 | $28.78/hr | Actual |
| 2020 | $30.86/hr | Actual |
| 2021 | $35.56/hr | Actual |
| 2022 | $35.13/hr | Actual |
| 2023 | $33.96/hr | Actual |
| 2024 | $36.18/hr | Actual |
| 2025 | $39.86/hr | Actual |
| 2026(current) | $40.71/hr | Estimated |
| 2027 | $41.57/hr | Projected |
Based on 7 years of BLS OEWS metropolitan area data, the median hourly rate for electricians in Walla Walla grew 38.5% from $28.78/hr (2019) to $39.86/hr (2025). At a 2.12% projected growth rate, hourly pay is expected to reach $41.57/hr by 2027. Part-time and per-diem electricians can use this multi-year trend to benchmark future contract negotiations.
Note: Historical values (2019–2025) are actual BLS OEWS figures for the Walla Walla metropolitan area, sourced from annual Occupational Employment and Wage Statistics surveys. 2026–2026 figures are current estimates, and 2027 values are projections, calculated using a 2.12% CAGR derived from 7-year BLS historical data. Actual salaries may vary based on employer, experience, certifications, and local market conditions.
Working as an Hourly Electrician in Walla Walla
When considering part-time work, a Walla Walla electrician working 24 hours a week could expect to earn an annual income that closely resembles a full-time salary, especially in high-demand fields like commercial projects or specialty industrial work. Moreover, per-diem work presents significant earning potential, with travel electricians typically earning between $35 to $60 per hour, plus daily per diem rates of $80-$150 for out-of-town assignments, and even higher for storm-related utility work. Rates fluctuate based on employer type; union electricians often enjoy higher wages due to negotiated benefits, while non-union contractors might offer better hourly rates devoid of health insurance. Therefore, electricians need to assess their priorities, as some may choose lower hourly rates in exchange for consistent benefits. Negotiating rates effectively based on skills and project needs can lead to favorable outcomes in this competitive Walla Walla market, creating an environment where both personal requirements and industry demands influence hourly pay.
More salary data for Walla Walla, WA:
Frequently Asked Questions
What is the hourly rate for electricians in Walla Walla in 2026?
How much do part-time electricians make in Walla Walla?
Are electricians in Walla Walla paid hourly or salary?
How much does a full-time electrician make per year in Walla Walla?
Do electricians earn more per hour working part-time in Walla Walla?
Related Pages
Compare Salaries
Career Resources
Nearby Cities in Washington
Written by Samuel Carter, Career Analyst
Career Analyst
Samuel Carter has over 10 years of experience as an electrician. His focus includes residential wiring and safety standards. He has worked in various construction firms.
Methodology & Data Source
Hourly wage figures on this page are 2026 projections based on the Bureau of Labor Statistics Occupational Employment and Wage Statistics (OEWS) survey, May 2026 release. A 2.12% compound annual growth rate (CAGR), derived from 6-year national BLS wage trends, was applied to estimate current 2026 hourly rates for electricians in Walla Walla. Part-time and full-time income estimates assume consistent weekly hours and do not account for overtime, benefits, or seasonal variation.
Data Sources & Methodology
Source: BLS, OEWS, 7-year dataset (–). Per-city data from annual BLS metropolitan area surveys.
2026 figures are projected from 2025 BLS data using a compound annual growth rate (CAGR) of 2.12%, derived from historical BLS wage trends for electricians (SOC 47-2111).
Compiled and verified by Samuel Carter, Career Analyst, a licensed electrician with 10+ years of clinical experience. · View source data at BLS.gov