Electrician Salary in Rutland, VT: $61,895 (2026)
Quick Answer:A full-time electrician in Rutland, VT earns a median $61,895/year (≈ $29.76/hour) in nominal terms for 2026 — projected from BLS OEWS 2025 (SOC 47-2111). Once you factor in Rutland's price level (4% above national, BEA RPP 103.5), that paycheck buys what $59,802 would nationally. Nominal pay sits 7.3% below the Vermont state average.
Based on BLS state-level estimates · View source
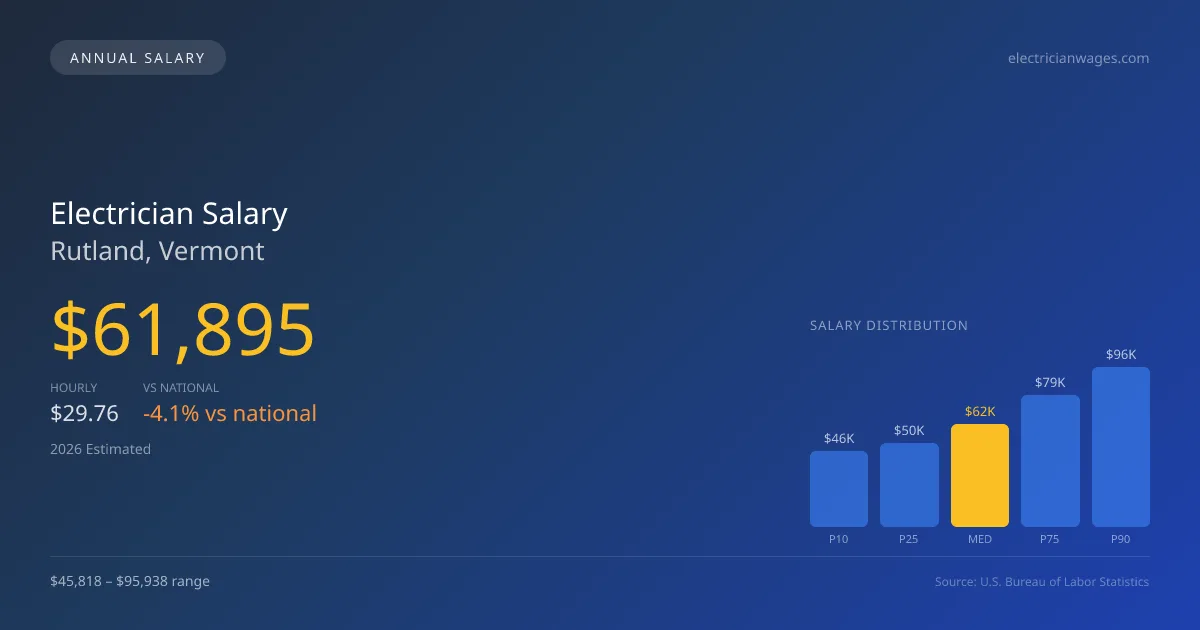
In 2026, electricians in Rutland, Vermont, can expect a median annual salary of $61,895, reflecting the ongoing developments in solar PV, EV charging, and data center projects that are reshaping the local market. This compensation aligns closely with the region's evolving energy sector, with salaries within the range of $45,818 at the lower end and $95,938 for the most experienced roles. These figures are based on estimates derived from 2025 BLS data, adjusted for local cost variations. As businesses in Rutland invest heavily in renewable infrastructure and technological enhancements, the demand for qualified electricians is likely to rise, potentially driving salaries higher in the coming years.
About the Rutland Market
Salary estimated from Vermont average ($64,000) adjusted for local cost of living.
Salary Breakdown
| Percentile | Annual | Hourly |
|---|---|---|
| Entry Level (P10) | $45,818 | $22.03 |
| Lower Range (P25) | $50,469 | $24.26 |
| Median (P50)(typical) | $61,895 | $29.76 |
| Upper Range (P75) | $79,226 | $38.09 |
| Top Earners (P90) | $95,938 | $46.13 |
Median Salary Position
4.08% below the national average
2026 Salary Percentile Distribution in Rutland
In Rutland, VT, the electrician salary spread from the 10th to 90th percentile is $50,120 (2026 est.). At $61,895, the local median is 4.08% below the national median of $64,530.
Salary Calculator
At 40 hours/week in Rutland: You'd be in the lower-middle range
How Rutland Electrician Pay Compares
Rutland median: $61,895/year (2026)
| Compared To | Median Salary | Rutland Pays |
|---|---|---|
| Vermont Average | $66,769 | -7.30% less |
| National Average | $64,530 | -4.08% less |
Electricians in Rutland, VT earn a median of $61,895 per year (2026 est.), which is 4.08% lower than the national median of $64,530 and 7.30% below the Vermont state average of $66,769.
Cost-of-Living Adjusted Salary
Rutland has a cost of living 3.50% above the national average.
Adjusted salary = nominal × (100 / CoL index). CoL index: 100 = national average.
Rutland, VT has a cost-of-living index of 103.5 (above the national average of 100). While the nominal salary of $61,895 is competitive, the higher cost of living reduces purchasing power to an effective $59,802 — a 3.38% reduction.
Compare Purchasing Power
Select a city to see how your salary compares after cost of living
Select a city above to compare purchasing power
2019 BLS Actual
$53,886
2025 BLS Actual
$60,610
2026 Current Est.
$61,895
2019–2027 Growth
+17.3%
Salary Trajectory for Electricians in Rutland (2019–2027)
2019–2025: actual BLS OEWS data for this metro area. 2026+: CAGR 2.12% projection.
| Year | Annual Salary | Status |
|---|---|---|
| 2019 | $53,886 | Actual |
| 2020 | $54,577 | Actual |
| 2021 | $57,589 | Actual |
| 2022 | $57,780 | Actual |
| 2023 | $59,075 | Actual |
| 2024 | $61,386 | Actual |
| 2025 | $60,610 | Actual |
| 2026(current) | $61,895 | Estimated |
| 2027 | $63,207 | Projected |
Based on 7 years of BLS OEWS data for the Rutland metropolitan area, the median electrician salary grew 12.5% from $53,886 (2019) to $60,610 (2025). At a 2.12% compound annual growth rate, salaries are projected to reach $63,207 by 2027 — a total increase of $9,321 (17.30%) from 2019.
Note: Historical values (2019–2025) are actual BLS OEWS figures for the Rutland metropolitan area, sourced from annual Occupational Employment and Wage Statistics surveys. 2026–2026 figures are current estimates, and 2027 values are projections, calculated using a 2.12% CAGR derived from 7-year BLS historical data. Actual salaries may vary based on employer, experience, certifications, and local market conditions.
Salary by Experience Level
| Experience | Estimated Salary Range |
|---|---|
| 0-2 years (New Graduate) | $45,818 – $50,469 |
| 3-5 years (Mid Career) | $50,469 – $61,895 |
| 5+ years (Experienced) | $61,895 – $79,226 |
| 10+ years (Top Earner) | $79,226 – $95,938 |
ELEC salary ranges estimated from BLS percentile data. Individual electrician compensation varies by employer, certifications, and specialization.
Electrician Job Market in Rutland
Currently, the job market in Rutland employs a small pool of four electricians, which indicates a niche yet growing opportunity in this sector. The cost of living index at 103.5 suggests that while expenses slightly exceed the national average, it provides context for evaluating electrician pay in Rutland, VT. High-end employers often include union electrical contractors delivering commercial services, which can offer substantial benefits and wages compared to non-union counterparts focusing on residential work. Additionally, specialized skills in industrial maintenance or emerging areas like renewable energy can significantly increase earning potential. For those looking to maximize their electrician salary in Rutland, pursuing union membership, gaining master or contractor licenses, and seeking certifications in high-demand fields are effective strategies to enhance overall pay.
More salary data for Rutland, VT:
Frequently Asked Questions
How much do electricians make in Rutland, VT in 2026?
Is Rutland, VT a good place to work as a electrician?
Can electricians make $100K in Rutland?
What is the cost-of-living adjusted electrician salary in Rutland?
How much does a electrician make per hour in Rutland?
Related Pages
Compare Salaries
Career Resources
Nearby Cities in Vermont
Written by Samuel Carter, Career Analyst
Career Analyst
Samuel Carter has over 10 years of experience as an electrician. His focus includes residential wiring and safety standards. He has worked in various construction firms.
Methodology & Data Source
Salary figures on this page are 2026 projections based on the Bureau of Labor Statistics Occupational Employment and Wage Statistics (OEWS) survey, May 2026 release. The BLS reported a median annual salary of $60,610 for electriciansin the Rutland metropolitan area. A 2.12% compound annual growth rate (CAGR), calculated from 6-year national BLS wage trends, was applied to project current 2026 compensation. Percentile ranges (P10–P90) represent the full salary distribution across experience levels and practice settings in this market.
Data Sources & Methodology
Salary data for Rutland is estimated from official BLS state-level occupational wage data (2025), adjusted for regional cost-of-living differences using BEA RPP (Regional Price Parities).
2026 figures are projected from 2025 BLS data using a compound annual growth rate (CAGR) of 2.12%, derived from historical BLS wage trends for electricians (SOC 47-2111).
Compiled and verified by Samuel Carter, Career Analyst, a licensed electrician with 10+ years of clinical experience. · View source data at BLS.gov