Electrician Hourly Pay in Norfolk, NE: $26.44 (2026)
Quick Answer:Hourly pay for a electrician working in Norfolk, NE runs $26.44 at the median for 2026 — annualizing to $54,990 at a standard 2,080-hour year. Figures projected from BLS OEWS 2025 (SOC 47-2111). Weighted against Norfolk's regional price level (BEA RPP 91.5, 8% below national), each hour of work buys what $28.89 nationally would. A 24-hour part-time schedule grosses $32,996 per year.
Based on BLS state-level estimates · View source
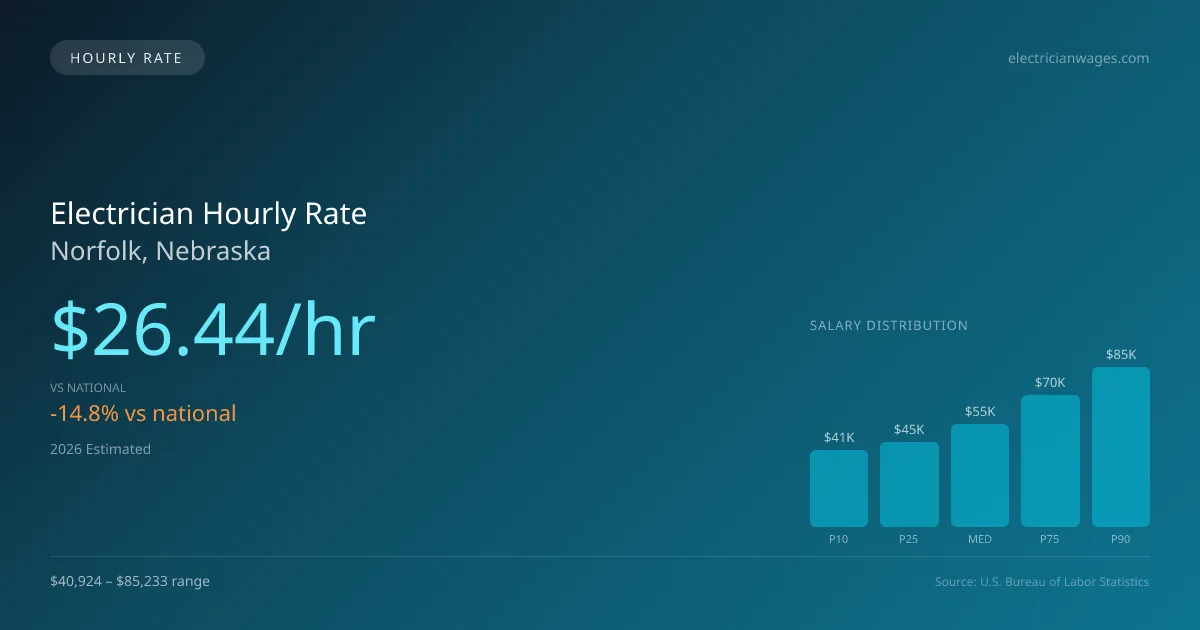
In Norfolk, Nebraska, the electrician hourly pay is projected to be $26.44 in 2026, which is notably lower than the national hourly median of $31.02. This discrepancy may affect local electricians differently based on their work arrangements, especially those seeking part-time roles or per-diem positions. For example, an electrician working three days a week might find this hourly rate suitable for a comfortable living, especially when engaging in residential service calls or industrial projects. The hourly range spans from $19.68 for entry-level positions at the 10th percentile to $40.98 for top earners at the 90th percentile, reflecting the variation in skills and responsibilities across different job settings such as utility work, commercial construction, and self-employed contracting.
About the Norfolk Market
Salary estimated from Nebraska average ($60,000) adjusted for local cost of living.
Electrician Hourly Wage Breakdown
| Percentile | Hourly Rate | Per 8hr Shift |
|---|---|---|
| Entry Level (P10) | $19.68 | $157.43 |
| Lower Range (P25) | $21.72 | $173.77 |
| Median (P50) | $26.44 | $211.51 |
| Upper Range (P75) | $33.84 | $270.74 |
| Top Earners (P90) | $40.98 | $327.85 |
Estimated Annual Income by Work Schedule in Norfolk
Based on $26.44/hr median hourly rate · 2026 est.
At $26.44/hr, a electrician working full-time (40 hr/wk) in Norfolk, NE can expect to earn approximately $54,993 per year (2026 est.). Part-time hygienists working 24 hours per week would earn around $31,727. With a cost-of-living index of 91.50 (below the national average), these earnings stretch further in Norfolk.
Hourly Rate Calculator
Schedule Comparison in Norfolk
| Schedule | Weekly | Monthly | Annual |
|---|---|---|---|
| Full-Time (40 hrs) | $1,057.55 | $4,583 | $54,993 |
| Part-Time (24 hrs) | $634.53 | $2,750 | $32,996 |
| Per Diem (16 hrs) | $423.02 | $1,833 | $21,997 |
Compare ELEC Wages With Similar Roles
| Role | Median Hourly |
|---|---|
| Electrician (Norfolk) | $26.44 |
| Plumber (National Avg) | $32.85 |
| HVAC Technician (National Avg) | $28.47 |
| Industrial Machinery Mechanic (National Avg) | $29.53 |
| Solar PV Installer (National Avg) | $24.85 |
Electricians in Norfolk, NE earn a median of $54,990 per year (2026 est.), which is 14.78% lower than the national median of $64,530 and 6.90% below the Nebraska state average of $59,065.
Electrician Hourly Pay vs. Cost of Living
Working 24h/week at $26.44/hr = $32,996/year (purchasing power: $36,061).
Working 40h/week (full-time) = $54,993/year (purchasing power: $60,101).
CoL index: 91.5 (100 = national average). Your dollars stretch further here.
2019 BLS Actual
$23.02/hr
2025 BLS Actual
$25.89/hr
2026 Current Est.
$26.44/hr
2019–2027 Growth
+17.3%
Hourly Rate Trajectory for Electricians in Norfolk (2019–2027)
2019–2025: actual BLS OEWS data for this metro area. 2026+: CAGR 2.12% projection.
| Year | Hourly Rate | Status |
|---|---|---|
| 2019 | $23.02/hr | Actual |
| 2020 | $23.31/hr | Actual |
| 2021 | $24.60/hr | Actual |
| 2022 | $24.68/hr | Actual |
| 2023 | $25.23/hr | Actual |
| 2024 | $24.58/hr | Actual |
| 2025 | $25.89/hr | Actual |
| 2026(current) | $26.44/hr | Estimated |
| 2027 | $27.00/hr | Projected |
Based on 7 years of BLS OEWS metropolitan area data, the median hourly rate for electricians in Norfolk grew 12.5% from $23.02/hr (2019) to $25.89/hr (2025). At a 2.12% projected growth rate, hourly pay is expected to reach $27.00/hr by 2027. Part-time and per-diem electricians can use this multi-year trend to benchmark future contract negotiations.
Note: Historical values (2019–2025) are actual BLS OEWS figures for the Norfolk metropolitan area, sourced from annual Occupational Employment and Wage Statistics surveys. 2026–2026 figures are current estimates, and 2027 values are projections, calculated using a 2.12% CAGR derived from 7-year BLS historical data. Actual salaries may vary based on employer, experience, certifications, and local market conditions.
Working as an Hourly Electrician in Norfolk
Part-time electricians in Norfolk looking to work 24 hours a week can anticipate an annual income significantly lower than their full-time counterparts. In fact, an electrician may bring home around $33,057 working part-time, while full-time salaries can reach up to $54,990 or higher, depending on the employer type. For those considering per-diem work, electricians on out-of-town projects often earn between $80 to $150 per day in addition to an hourly rate ranging from $35 to $60. In specialized fields, like industrial PLC work, pay can rise to $80-$140 per hour as contractors seek individuals with specific skills. Employers in this area differ widely; unionized positions often offer premiums of 30-50% over non-union jobs, along with benefits like health insurance and pensions. Negotiating an hourly rate can be tactical; electricians might prioritize higher pay while working independently versus the benefits of union membership, leading to a careful balance when considering job offers in Norfolk's evolving electrical markets.
More salary data for Norfolk, NE:
Frequently Asked Questions
What is the hourly rate for electricians in Norfolk in 2026?
How much do part-time electricians make in Norfolk?
Are electricians in Norfolk paid hourly or salary?
How much does a full-time electrician make per year in Norfolk?
Do electricians earn more per hour working part-time in Norfolk?
Related Pages
Compare Salaries
Career Resources
Nearby Cities in Nebraska
Written by Samuel Carter, Career Analyst
Career Analyst
Samuel Carter has over 10 years of experience as an electrician. His focus includes residential wiring and safety standards. He has worked in various construction firms.
Methodology & Data Source
Hourly wage figures on this page are 2026 projections based on the Bureau of Labor Statistics Occupational Employment and Wage Statistics (OEWS) survey, May 2026 release. A 2.12% compound annual growth rate (CAGR), derived from 6-year national BLS wage trends, was applied to estimate current 2026 hourly rates for electricians in Norfolk. Part-time and full-time income estimates assume consistent weekly hours and do not account for overtime, benefits, or seasonal variation.
Data Sources & Methodology
Salary data for Norfolk is estimated from official BLS state-level occupational wage data (2025), adjusted for regional cost-of-living differences using BEA RPP (Regional Price Parities).
2026 figures are projected from 2025 BLS data using a compound annual growth rate (CAGR) of 2.12%, derived from historical BLS wage trends for electricians (SOC 47-2111).
Compiled and verified by Samuel Carter, Career Analyst, a licensed electrician with 10+ years of clinical experience. · View source data at BLS.gov