Electrician Salary in Norfolk, NE: $54,990 (2026)
Quick Answer:A full-time electrician in Norfolk, NE earns a median $54,990/year (≈ $26.44/hour) in nominal terms for 2026 — projected from BLS OEWS 2025 (SOC 47-2111). Once you factor in Norfolk's price level (8% below national, BEA RPP 91.5), that paycheck buys what $60,098 would nationally. Nominal pay sits 6.9% below the Nebraska state average.
Based on BLS state-level estimates · View source
In 2026, electricians in Norfolk, Nebraska, can expect a median annual salary of $54,990, a figure that lags behind the national median of $64,530 by approximately 14.78%. The salary range for electricians locally spans from $40,924 at the 10th percentile to $85,233 at the 90th percentile, reflecting diverse opportunities within the field. These figures are informed by state-level data from BLS and adjusted for regional price parity, revealing a competitive, albeit lower, pay scale in Norfolk compared to national standards. The local electrician market comprises both unionized and non-union sectors, with the International Brotherhood of Electrical Workers (IBEW) generally offering more lucrative compensation packages, often up to 50% higher than non-union pay, which significantly influences earning potential in the area.
About the Norfolk Market
Salary estimated from Nebraska average ($60,000) adjusted for local cost of living.
Salary Breakdown
| Percentile | Annual | Hourly |
|---|---|---|
| Entry Level (P10) | $40,924 | $19.68 |
| Lower Range (P25) | $45,170 | $21.72 |
| Median (P50)(typical) | $54,990 | $26.44 |
| Upper Range (P75) | $70,386 | $33.84 |
| Top Earners (P90) | $85,233 | $40.98 |
Median Salary Position
14.78% below the national average
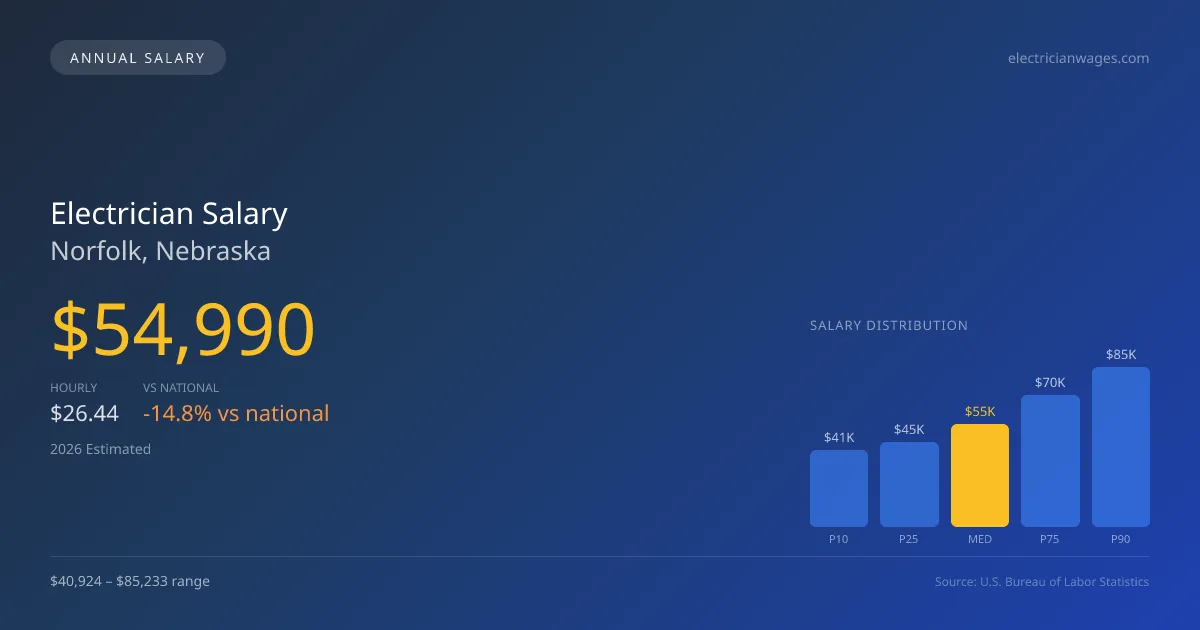
2026 Salary Percentile Distribution in Norfolk
In Norfolk, NE, the electrician salary spread from the 10th to 90th percentile is $44,309 (2026 est.). At $54,990, the local median is 14.78% below the national median of $64,530.
Salary Calculator
At 40 hours/week in Norfolk: You'd be in the lower-middle range
How Norfolk Electrician Pay Compares
Norfolk median: $54,990/year (2026)
| Compared To | Median Salary | Norfolk Pays |
|---|---|---|
| Nebraska Average | $59,065 | -6.90% less |
| National Average | $64,530 | -14.78% less |
Electricians in Norfolk, NE earn a median of $54,990 per year (2026 est.), which is 14.78% lower than the national median of $64,530 and 6.90% below the Nebraska state average of $59,065.
Cost-of-Living Adjusted Salary
Norfolk has a cost of living 8.50% below the national average, meaning your salary goes further here.
Adjusted salary = nominal × (100 / CoL index). CoL index: 100 = national average.
Norfolk, NE has a cost-of-living index of 91.5 (below the national average of 100). A electrician earning $54,990 nominally has purchasing power equivalent to $60,098 in an average-cost city — an effective 9.29% boost.
Compare Purchasing Power
Select a city to see how your salary compares after cost of living
Select a city above to compare purchasing power
2019 BLS Actual
$47,874
2025 BLS Actual
$53,848
2026 Current Est.
$54,990
2019–2027 Growth
+17.3%
Salary Trajectory for Electricians in Norfolk (2019–2027)
2019–2025: actual BLS OEWS data for this metro area. 2026+: CAGR 2.12% projection.
| Year | Annual Salary | Status |
|---|---|---|
| 2019 | $47,874 | Actual |
| 2020 | $48,488 | Actual |
| 2021 | $51,164 | Actual |
| 2022 | $51,334 | Actual |
| 2023 | $52,485 | Actual |
| 2024 | $51,129 | Actual |
| 2025 | $53,848 | Actual |
| 2026(current) | $54,990 | Estimated |
| 2027 | $56,155 | Projected |
Based on 7 years of BLS OEWS data for the Norfolk metropolitan area, the median electrician salary grew 12.5% from $47,874 (2019) to $53,848 (2025). At a 2.12% compound annual growth rate, salaries are projected to reach $56,155 by 2027 — a total increase of $8,281 (17.30%) from 2019.
Note: Historical values (2019–2025) are actual BLS OEWS figures for the Norfolk metropolitan area, sourced from annual Occupational Employment and Wage Statistics surveys. 2026–2026 figures are current estimates, and 2027 values are projections, calculated using a 2.12% CAGR derived from 7-year BLS historical data. Actual salaries may vary based on employer, experience, certifications, and local market conditions.
Salary by Experience Level
| Experience | Estimated Salary Range |
|---|---|
| 0-2 years (New Graduate) | $40,924 – $45,170 |
| 3-5 years (Mid Career) | $45,170 – $54,990 |
| 5+ years (Experienced) | $54,990 – $70,386 |
| 10+ years (Top Earner) | $70,386 – $85,233 |
ELEC salary ranges estimated from BLS percentile data. Individual electrician compensation varies by employer, certifications, and specialization.
Electrician Job Market in Norfolk
Looking at the local employment landscape, there are currently six electricians working in Norfolk, highlighting both a niche market and the potential for growth. With a cost of living index of 91.5, professionals in the electrical trade enjoy a slightly lower cost environment, which can enhance overall purchasing power despite lower hourly rates compared to national figures. Among employers, union electrical contractors typically pay the most, particularly in commercial and industrial contexts, while non-union contractors mainly focus on residential work and may offer different pay scales. The significant spread between low and high salaries is driven by factors such as specialty areas (like industrial controls and solar energy), required licensing, and available overtime. For those looking to maximize their earnings in Norfolk, pursuing an IBEW apprenticeship and gaining experience in high-demand specialties is advisable, as these paths are more likely to lead to increased compensation in this evolving job market.
More salary data for Norfolk, NE:
Frequently Asked Questions
How much do electricians make in Norfolk, NE in 2026?
Is Norfolk, NE a good place to work as a electrician?
Can electricians make $100K in Norfolk?
What is the cost-of-living adjusted electrician salary in Norfolk?
How much does a electrician make per hour in Norfolk?
Related Pages
Compare Salaries
Career Resources
Nearby Cities in Nebraska
Written by Samuel Carter, Career Analyst
Career Analyst
Samuel Carter has over 10 years of experience as an electrician. His focus includes residential wiring and safety standards. He has worked in various construction firms.
Methodology & Data Source
Salary figures on this page are 2026 projections based on the Bureau of Labor Statistics Occupational Employment and Wage Statistics (OEWS) survey, May 2026 release. The BLS reported a median annual salary of $53,848 for electriciansin the Norfolk metropolitan area. A 2.12% compound annual growth rate (CAGR), calculated from 6-year national BLS wage trends, was applied to project current 2026 compensation. Percentile ranges (P10–P90) represent the full salary distribution across experience levels and practice settings in this market.
Data Sources & Methodology
Salary data for Norfolk is estimated from official BLS state-level occupational wage data (2025), adjusted for regional cost-of-living differences using BEA RPP (Regional Price Parities).
2026 figures are projected from 2025 BLS data using a compound annual growth rate (CAGR) of 2.12%, derived from historical BLS wage trends for electricians (SOC 47-2111).
Compiled and verified by Samuel Carter, Career Analyst, a licensed electrician with 10+ years of clinical experience. · View source data at BLS.gov